The spinner keeps turning, then the page says "504 Gateway Timeout". Or Matomo shows "Oops… there was a problem during the request". The CSV export dies halfway, and the nightly API script gets an error page instead of data.
Usually this isn't a bug in Matomo: a request has more work to do than one link in the chain allows time for. This article covers where those limits sit, why Matomo hits them and what Matomo itself recommends.
To be clear about scope: if archiving itself hangs or reports stay empty for days, see our article on Matomo archiving problems. General server and database tuning is covered in Matomo performance tuning.
Where the time limits sit#
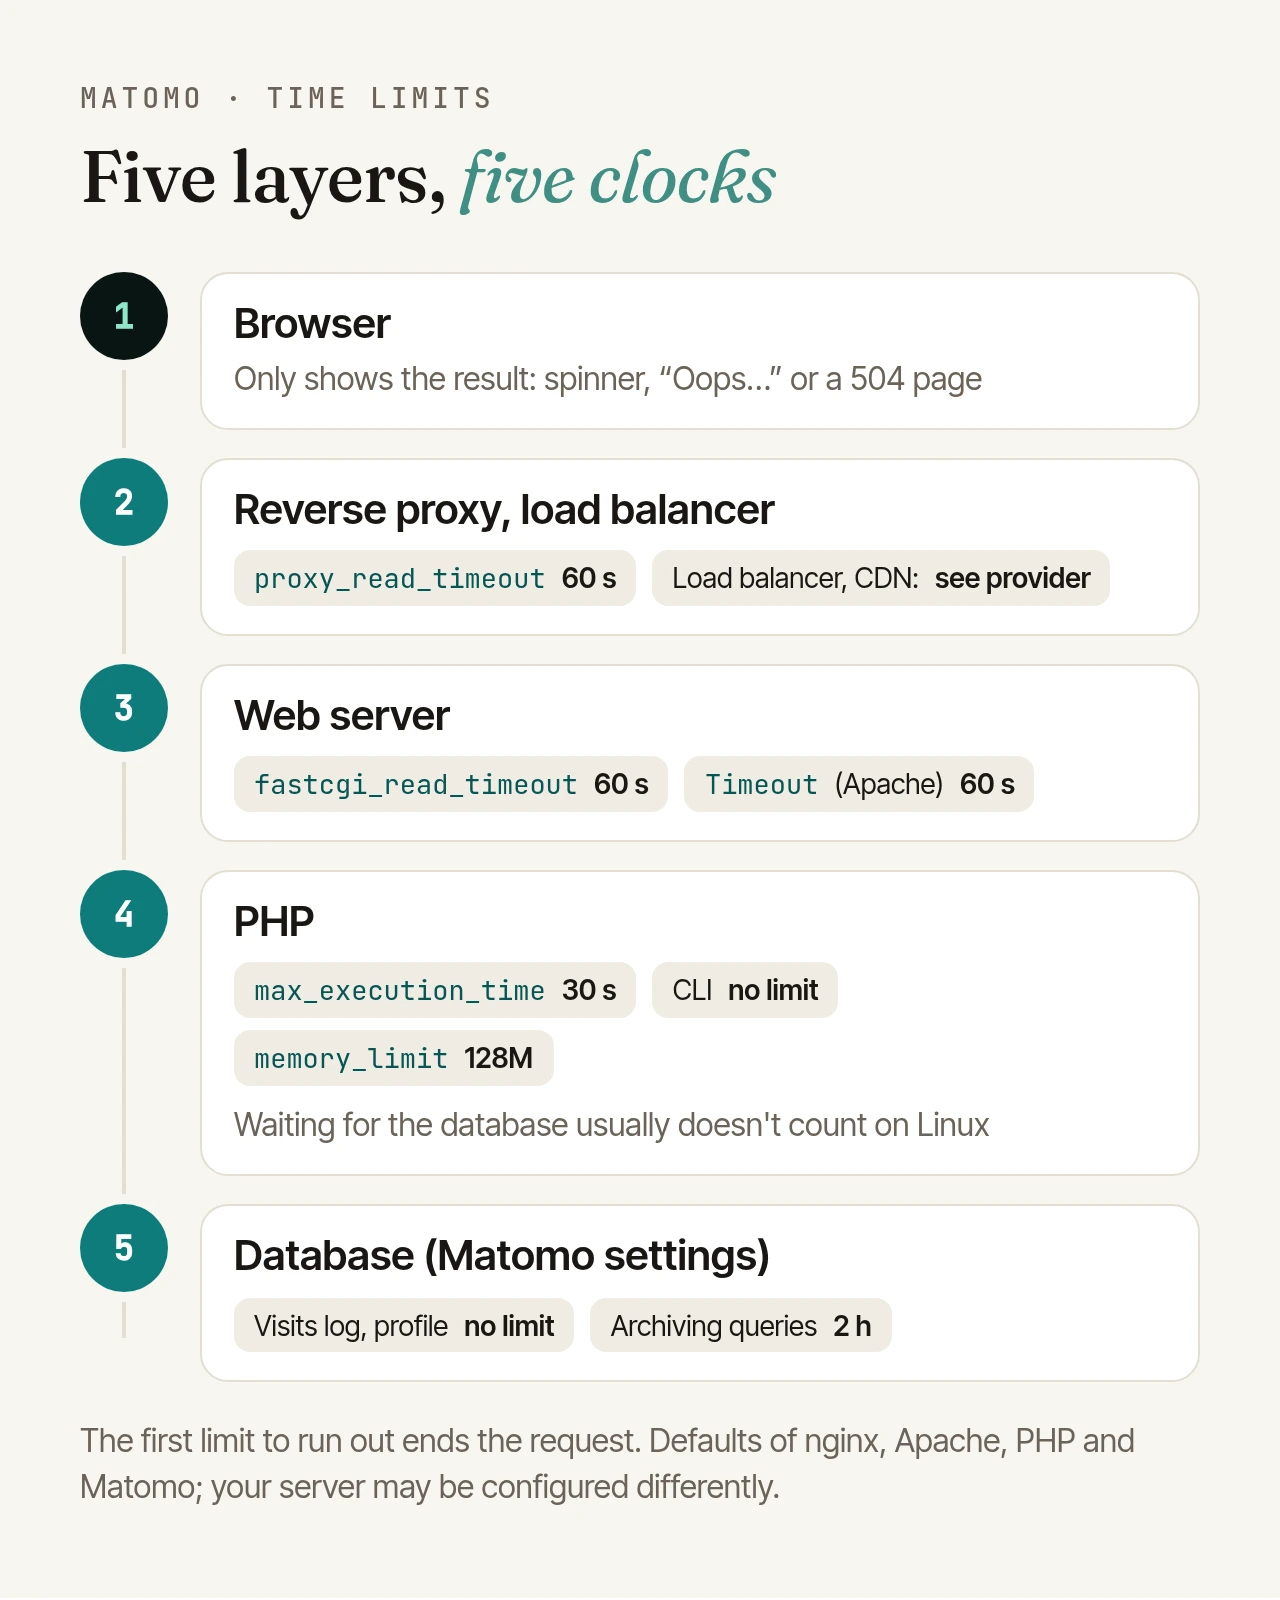
A request to Matomo passes through several layers, each with its own clock. Whichever runs out first ends the request. That is what a 504 means in the HTTP standard: a gateway or proxy didn't get a timely response from the server behind it.
- Browser: shows only the outcome: a spinner, "Oops…" or an error page.
- Reverse proxy or load balancer: a proxy in front of Matomo only waits so long; for nginx,
proxy_read_timeoutdefaults to 60 seconds. Load balancers and CDNs have their own limits, documented by your provider. - Web server: nginx waits for PHP-FPM according to
fastcgi_read_timeout, also 60 seconds by default. When it expires, nginx logs "upstream timed out" and returns a 504. On Apache,Timeoutapplies (default 60 seconds); if PHP-FPM is connected viamod_proxy_fcgi,ProxyTimeoutcounts, which falls back to the value ofTimeout. - PHP:
max_execution_timestops a script after 30 seconds by default; on the command line the default is 0, meaning no limit.memory_limitcaps memory (default 128M). PHP-FPM can also kill a worker viarequest_terminate_timeout, which defaults to 0, meaning off. - Database: Matomo never stops visits log or visitor profile queries by default, and stops archiving queries after two hours.
One detail explains why the 504 so often comes from the web server: in the usual Linux setup, max_execution_time only counts the time the script itself spends running. According to the PHP manual, time spent waiting on database queries doesn't count. If Matomo waits 90 seconds for MySQL, the PHP limit never fires, but nginx gives up after 60.
Which layer was it?#
The logs usually tell you:
- "upstream timed out" in the nginx error log: nginx was waiting for PHP.
- "Maximum execution time of 30 seconds exceeded": PHP stopped the script.
- "Allowed memory size of … bytes exhausted": not a time limit but a memory problem. For archiving, Matomo recommends 512M or 2G depending on your data, and calls 8G common for medium to large instances.
core:archiveitself enforces at least 768 MB.
Why Matomo hits these limits#
Matomo stores raw data first; reports only exist once archiving has processed it. It gets expensive when that work happens during a browser or script request.
- Archiving on view. By default, Matomo processes reports when someone requests them in the interface. Today's reports count as outdated after 900 seconds and are processed again on the next view. Above a few hundred visits per day, Matomo says this can take minutes, and impatient reloading makes it worse.
- Real-time segments. New segments default to "segmented reports are processed in real time". Requests with such a segment trigger processing even when browser archiving is switched off.
- Custom date ranges. Cron archiving pre-processes days, weeks, months and years. It doesn't pre-process custom ranges (
period=range), except the defaults users can pick in their settings (last or previous 7 and 30 days). A report for "January 1 to today" is therefore processed on request, even with browser archiving disabled. - Exports without a limit. The API returns 100 rows by default. Pick "all" rows under a table or set
filter_limit=-1in the API, and you get everything in one response. For raw data exports, Matomo warns that beyond roughly 10,000 visits with their actions the request may take very long or time out. Matomo doesn't recommend going above 4G of memory for this, and says even that is sometimes not enough. - Many sites. Reports are built per website. Whatever is processed on request happens once for every site in an all-websites overview or an API call with
idSite=all. On very large servers tracking many busy sites, Matomo says archiving alone can take hours.
What Matomo recommends#
1. Cron archiving, browser archiving off#
The key step: process reports in the background on a schedule, not on view. The command line has no PHP time limit, and no web server is waiting. Matomo recommends an hourly run as the web server user:
5 * * * * /usr/bin/php /var/www/matomo/console core:archive --matomo-domain=https://analytics.example.org > /dev/null
Then go to Administration > System > General settings:
- "Archive reports when viewed from the browser": No
- "Archive reports at most every X seconds": 3600
To stop requests with a segment from triggering processing as well, add this to config/config.ini.php:
[General]
browser_archiving_disabled_enforce = 1
Switch your segments to pre-processing first (next section). Otherwise real-time segments stop showing data and display a notice that the configuration prevents real-time processing for performance reasons.
One catch: core:archive runs its work as separate command line processes. If the system doesn't support that, it sends HTTP requests to your own instance instead, and the web server limits apply again. To check:
./console diagnostics:run --all | grep -i "processes via cli"
Schedules, run times and stuck cron jobs are covered in the archiving article.
2. Pre-process segments#
In the segment editor, superusers can set any segment to "segmented reports are pre-processed (faster, requires cron)". Matomo explicitly recommends this when the real-time default makes reports slow. Three settings in config/config.ini.php help on instances with many users:
[General]
enable_create_realtime_segments = 0
process_new_segments_from = "segment_creation_time"
enable_segment_suggested_values = 0
The first forces new segments into pre-processing (existing real-time segments stay as they are). The second stops a new segment from processing your entire history. The third turns off value suggestions in the segment editor, as Matomo advises for very large databases.
Many segments only filter one section of a site, such as the blog or shop. For that there is our free Page Filter Report, one of our Plugins for Matomo: you define sections by URL pattern, and their reports are built during normal archiving.
3. Pre-process long date ranges#
If you need a particular range regularly, cron archiving can process it in advance:
[General]
archiving_custom_ranges[] = "last90"
Every entry adds archiving time, so only list ranges used often. In scripts, request period=month or period=day instead of period=range and add the numbers up yourself; those periods are ready after the cron run. Visits and pageviews add up, unique visitors don't.
4. Page through API results#
For large data sets, Matomo recommends fetching 10,000 rows per request with filter_limit and filter_offset:
?module=API&method=Live.getLastVisitsDetails&idSite=1&period=day&date=yesterday&format=json&filter_limit=10000&filter_offset=0
…&filter_limit=10000&filter_offset=10000
…&filter_limit=10000&filter_offset=20000
Repeat until no rows come back. Pull raw data one day at a time and send the token in a POST body, not the URL, as Matomo recommends for security. showColumns or hideColumns limit the transfer to the columns you need.
To keep a runaway visits log query from tying up the database indefinitely, you can cap it:
[General]
live_query_max_execution_time = 60
According to Matomo this only works with MySQL 5.7 or newer and the PDO_MYSQL extension; MariaDB may not support it. For archiving queries there is archiving_query_max_execution_time (default 7200 seconds). If such a query is stopped, the report may be missing, and Matomo won't notify you.
5. Scheduled reports instead of big ad hoc exports#
If you need the same numbers regularly, don't export them by hand. Scheduled reports go out daily, weekly or monthly by email as HTML, PDF or CSV. They are sent by the archiving cron; without it, sending depends on someone visiting one of your tracked sites. Each table holds 23 rows by default, adjustable with scheduled_reports_truncate, but only globally for all reports.
Tracking: when the endpoint can't keep up#
Timeouts happen on the tracking side too. Matomo writes every tracking request straight into the database, which according to the plugin documentation can take several hundred milliseconds. During peaks the server may not handle every request directly, for example because nginx or MySQL run out of connections.
For this, Matomo points to the QueuedTracking plugin. It writes tracking requests into a queue, preferably Redis, alternatively MySQL, which takes a few milliseconds, and processes them in batches. By default that happens during a tracking request, after the response has gone back to the browser. Alternatively, switch off "Process during tracking request" in the plugin settings and let a cron job do the work every minute:
* * * * * cd /var/www/matomo && ./console queuedtracking:process > /dev/null 2>&1
The trade-off: under load, new visits show up in the real-time reports with a delay.
What not to do#
Raising every limit just moves the problem: the browser waits longer, each long request ties up a PHP process, and requests pile up. If you raise a limit, do it along the whole chain; 300 seconds for PHP won't help if nginx gives up after 60. Heavy work belongs on the command line.
Checklist#
- Check the logs: web server, PHP or memory?
- Set up cron archiving, browser archiving off, today's reports at most hourly.
- Switch segments to pre-processing, then set
browser_archiving_disabled_enforce = 1. - Add frequently used custom ranges to
archiving_custom_ranges[]. - Page through API results with
filter_limitandfilter_offset, pull raw data per day. - Cap visits log queries with
live_query_max_execution_time. - Send recurring exports as scheduled reports.
- For tracking peaks, look at QueuedTracking.
If you'd rather not deal with this yourself: with our managed Matomo hosting, archiving runs as a monitored background job tuned to your traffic, alongside 24/7 monitoring, updates, backups and performance tuning. Moving your existing instance is included, and we reply to your enquiry within one business day.