Where do we lose visitors between the home page and the checkout? Which pages do prospects read before they get in touch? And what do campaign visitors do once they land? Matomo's page reports count views, entries and exits, but for each page on its own. Whether the 450 visits on the category page are the same visits that later reach the basket is not in any row.
This guide covers which questions about visitor paths Matomo answers out of the box and where that stops, how to prepare a path analysis, and how to read the results without fooling yourself. The preparation works with any tool. For the analysis itself we use our VisitJourney plugin.
What Matomo shows out of the box#
Matomo ships several reports that answer part of the question. Each one is good at something, and each one stops at a certain point:
- Entry and exit pages (Behaviour › Entry pages and Behaviour › Exit pages) show the page where visits start and the page where they end. They don't show what happens in between.
- Transitions (Behaviour › Transitions, or the icon that appears when you hover over a row in the Pages report) shows, for one page, what visitors did directly before and directly after viewing it. Before: internal pages, search engines, websites, campaigns, internal searches and direct entries. After: internal pages, internal searches, downloads, outlinks, exits and page reloads. That is exactly one step around exactly one page.
- Goal reports by page have been part of Matomo since 4.11: by page URL, page title and entry page. They show which pages were viewed in visits that converted and share each conversion equally across those pages. If a visitor viewed four pages before converting, each page gets a quarter, which is why you see decimal values. The order of those pages stays unknown.
- The Visits Log and the Visitor Profile (Visitors › Visits Log) show every visit with all its actions in order. That is ideal for understanding individual cases. Fifty visits give you an impression, fifty thousand don't give you a distribution.
- Segments filter entire visits, for example all visits that start on a given landing page or come from a campaign. A segment narrows every report down to those visits, but it doesn't show a sequence. Why segments always select whole visits is explained in our guide to campaign tracking in Matomo.
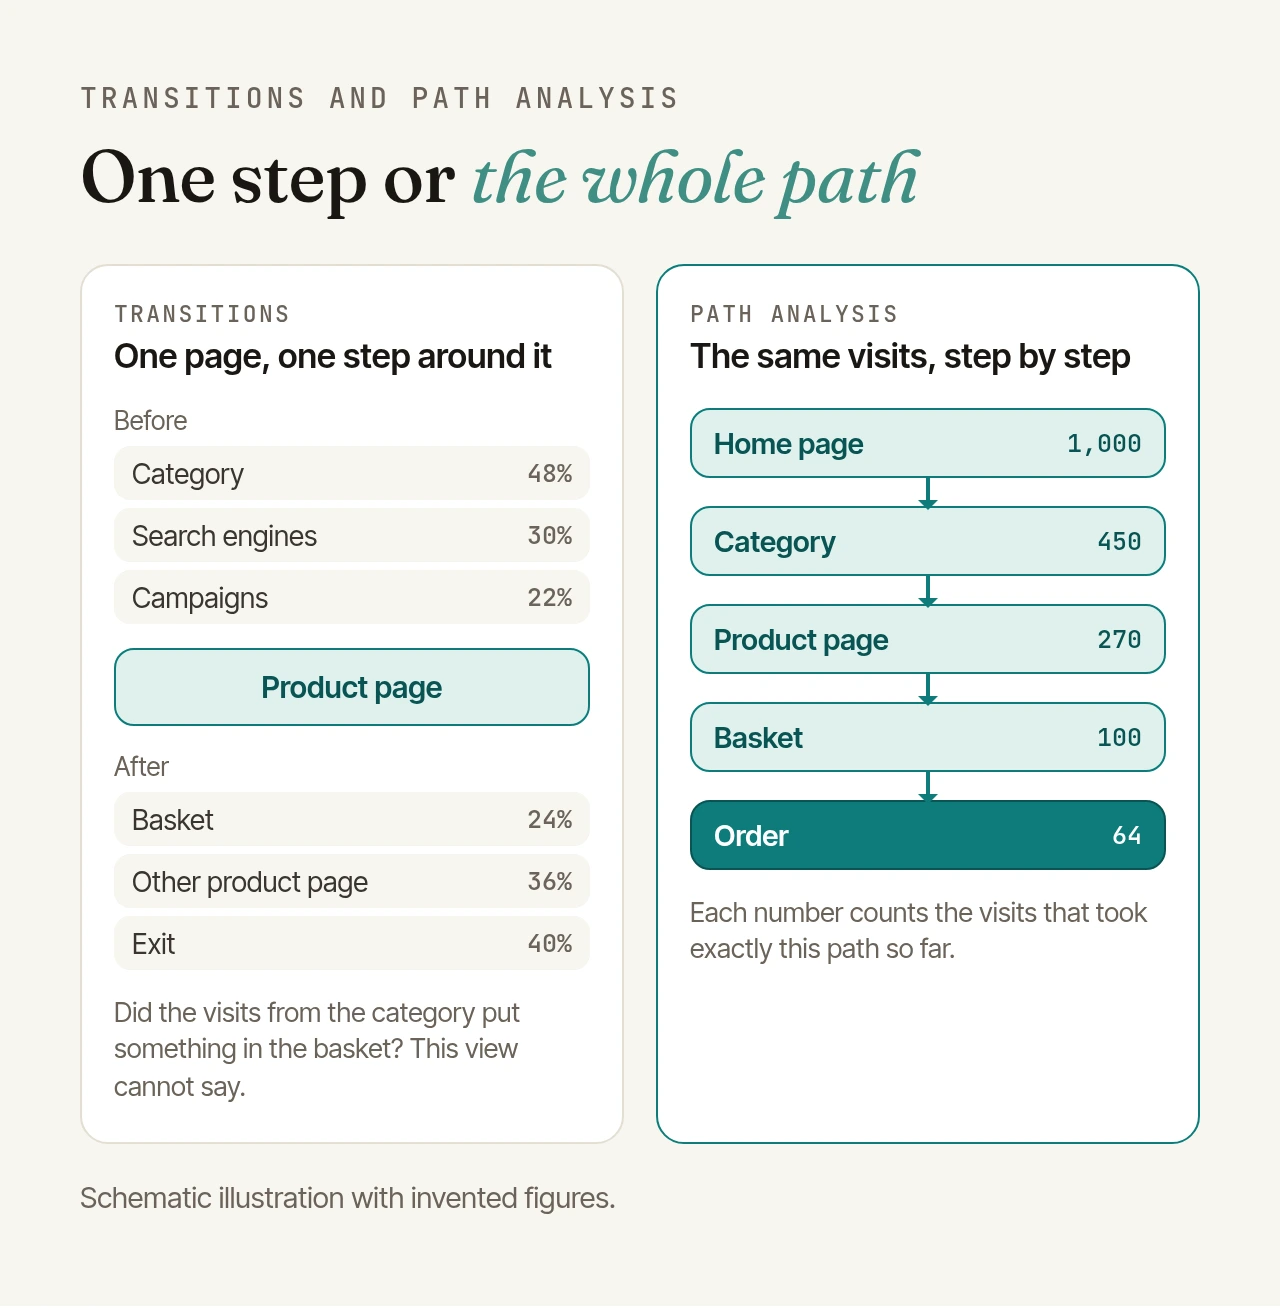
A report that follows the same visits across several steps and shows them as a whole is not part of Matomo itself. That is what a path analysis does.
What a path analysis adds#
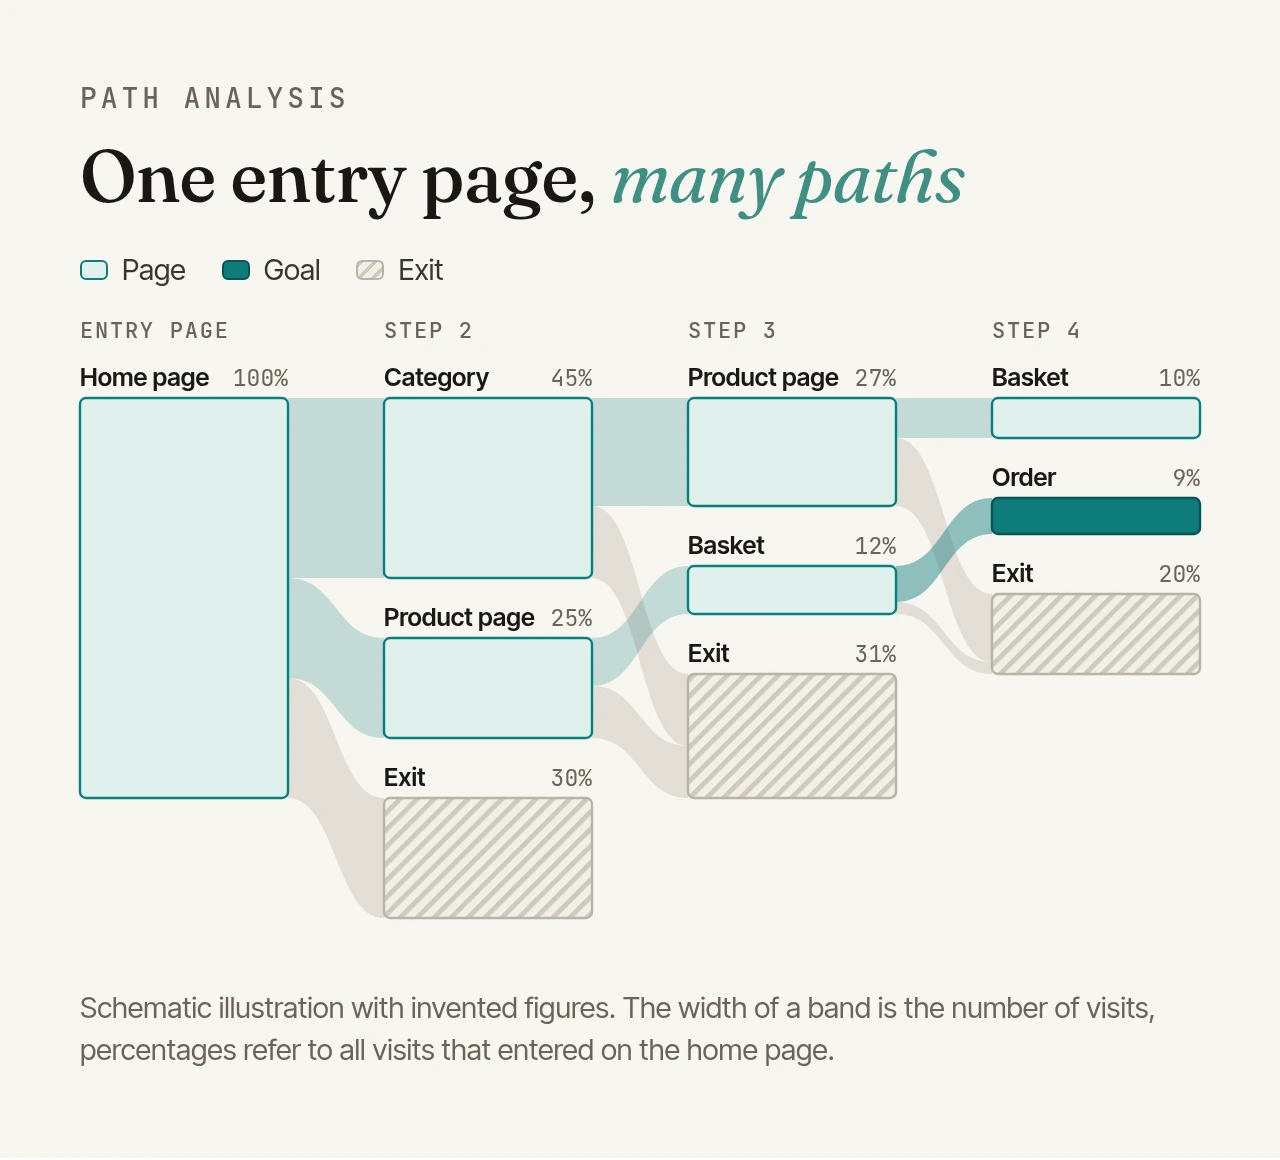
A path analysis groups visits into paths and counts how many took the same path. You can read it in two directions:
- Forward from the entry page: what do visitors do after they arrive? Where do they continue, where do they leave?
- Backward from a goal: what came before an order, an enquiry or a newsletter sign-up?
The usual chart is a flow chart (Sankey diagram). Each column is a step, each box a page, an event or a goal, and the width of the bands between them is the number of visits. Wide bands are the main routes, and a large exit after a step shows where visitors get stuck.
If you are coming from Google Analytics 4, you know the idea from path exploration. It draws a tree that either begins at a starting point or works backwards from an ending point, but not both at once. Nodes can be event names, page titles, page paths, screen names or screen classes. By default the chart shows the top five nodes per step, up to 20 with "+ More", and groups the rest. By default it counts events, alternatively total users.
Two limits apply to every exploration in GA4: explorations only use event data within the retention period, 2 or 14 months for standard properties, and queries that process more than 10 million events may be sampled. We cover these limits in our comparison GA4 now has dashboards: is Matomo still the better choice?. If you are planning the move, the steps are in our GA4 to Matomo migration plan.
How to prepare a path analysis#
A path chart shows everything in your data, including the noise. Whether it answers anything is decided before you open it. These five steps apply to any tool:
1. Write down two or three questions#
"What do our visitors do?" is not a question a chart can answer. "How many visits that enter on a blog article click through to the shop?" is. The question tells you the direction (forward from the entry page or backward from a goal), the period and the segment.
2. Group pages sensibly#
Without grouping, every product page is a box of its own. With 300 products, the visits split into 300 thin bands, and the rare ones end up under "(Others)". A group called "Product page" shows you instead how many visits reach a product page at all.
First decide whether pages appear by URL or by page title. URLs are stable and easy to group with patterns, titles are easier to read when URLs are made of IDs. In VisitJourney, a group is a regular expression plus a label:
| Pattern | Label | Effect |
|---|---|---|
^/products/ |
Product page | All product pages become one entry. |
^/blog/.+ |
Blog article | All articles become one entry, the /blog overview stays on its own. |
^shop\.example\.com/ |
Shop | All pages of a second domain tracked in the same website. |
A pattern that starts with ^/ is matched against the page path. Any other pattern is matched against the URL without protocol and without "www.". Matching ignores case, and the first matching rule names the page, so put specific rules at the top. If pages appear by title, the patterns are matched against the title, not the URL.
3. Pick the events that matter#
Events make paths more useful when they matter for the journey: a video start, a product configurator, the steps of a form. Scroll or technical events, on the other hand, would cut every path into lots of tiny steps. Pick a few event categories and leave out the rest.
4. Define goals cleanly#
By default, a goal in Matomo counts once per visit. With Allow Goal to be converted more than once per visit every conversion counts, for example for several downloads. For the paths before a goal this makes a difference, because each conversion then has its own path. Also check that a goal really measures what you want to analyse. "Visited /thank-you" also counts people who open the thank-you page again in a later visit, for example from a bookmark.
5. Clean the data#
Bot visits often consist of a single page. In a path analysis they inflate the exits right after the entry page, and the main route looks weaker than it is. The tools Matomo itself offers against spam traffic are covered in our article GA4 hostname filter: a new allowlist against spam traffic, and the Matomo way. Our plugin TrackingSpamScore keeps bot traffic out of new data, and the free DeleteVisitsFilter deletes bot visits that were already tracked.
Path analysis with VisitJourney#
VisitJourney is one of our Plugins for Matomo. It adds two views under Behaviour › Visit Journey: Paths from the entry page and Paths to the goal. Page views, selected events and goals are equal steps in both. The paths are calculated by Matomo's archiving, not when you open the report, and no extra tracking code is needed. The plugin requires Matomo 5.12 or later. The screenshots show a fictional outdoor shop with invented data.
Paths from the entry page#
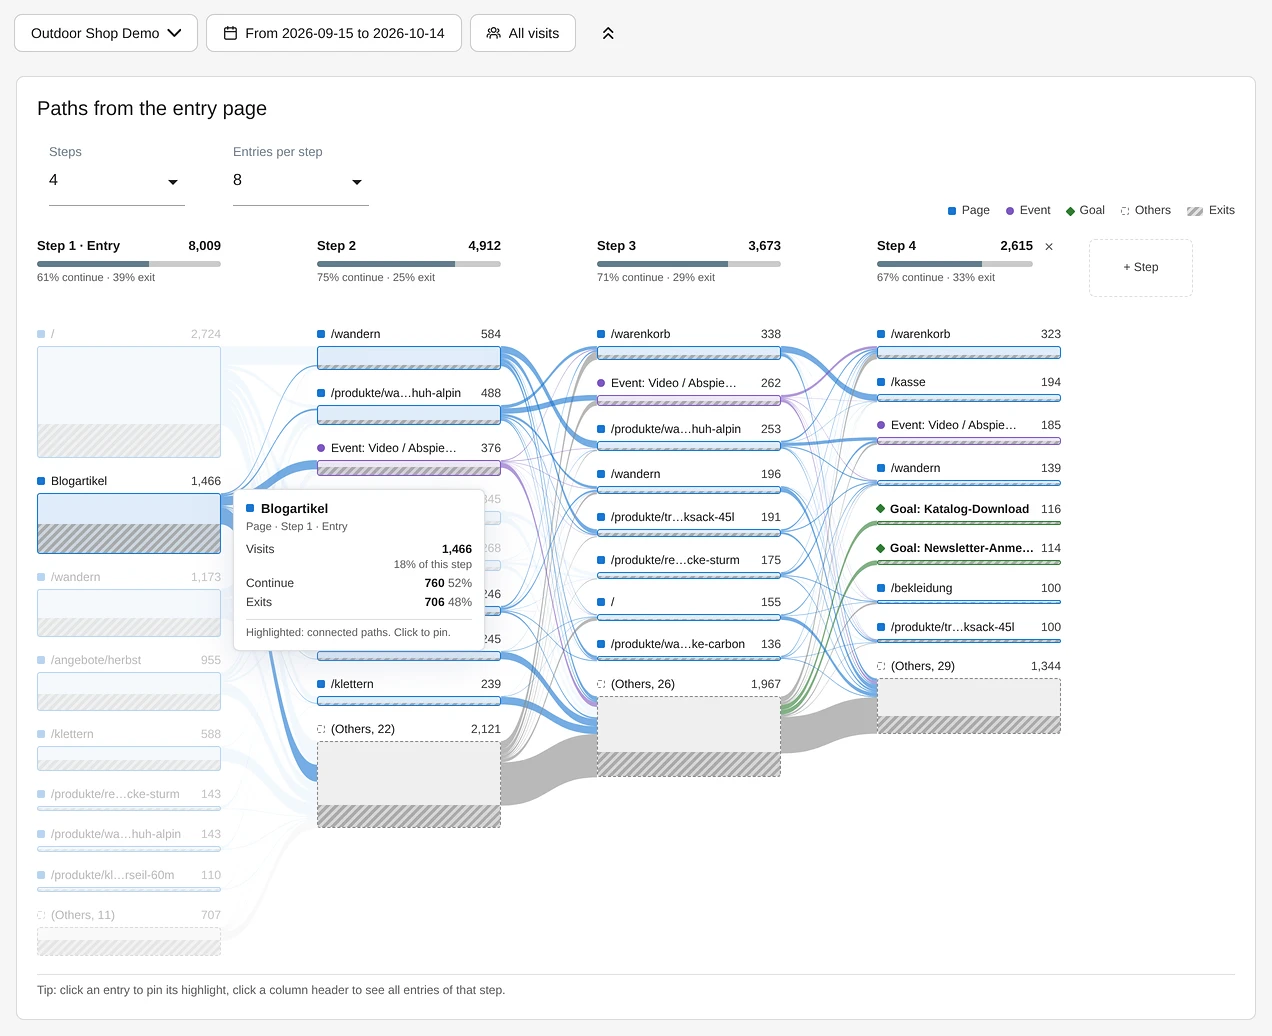
Each column is a step, and its header shows the total visits and the share that continues or exits. The hatched part of each entry is its exits. Steps and Entries per step (5 to 50) set how much the chart shows.
Hover over an entry and all connected paths are highlighted. A click pins the highlight, Esc or a click elsewhere releases it. In the example, 1,466 visits enter on a blog article and just over half of them click on. A click on a column header lists every entry of that step, not only those in the chart, up to 500 on screen, and the export delivers all of them as a CSV file. "(Others, 22)" groups the 22 rarer entries of a step.
Paths to the goal#
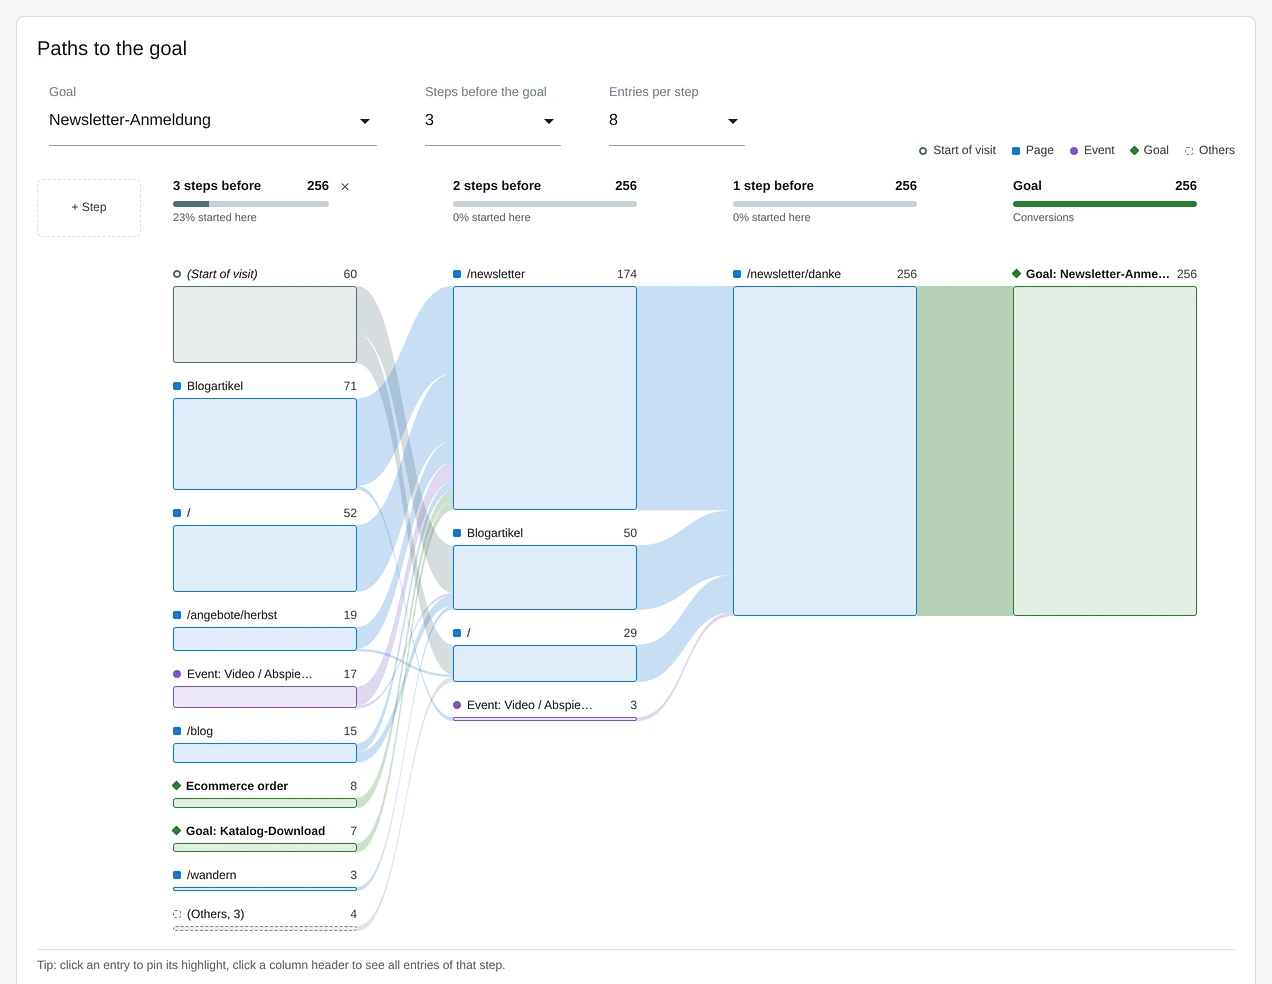
Paths to the goal reads from right to left: the goal with its conversions on the right, then 1 step before, 2 steps before and so on. "(Start of visit)" means there was no earlier step in this visit, so the entry to its right is the entry page. In the example it appears for 60 of the 256 sign-ups three steps before the goal, and the column header shows 23% "started here". These visits entered directly on the /newsletter page, a blog article or the home page and signed up two steps later. Blog articles rank high in both columns, so for this shop the blog is an important route to the sign-up.
With several goals you pick the goal at the top, with a search field from eight goals. On ecommerce websites the order is listed first. The same chart also appears on the page of every goal and, for orders, under Ecommerce › Overview.
Top sequences#
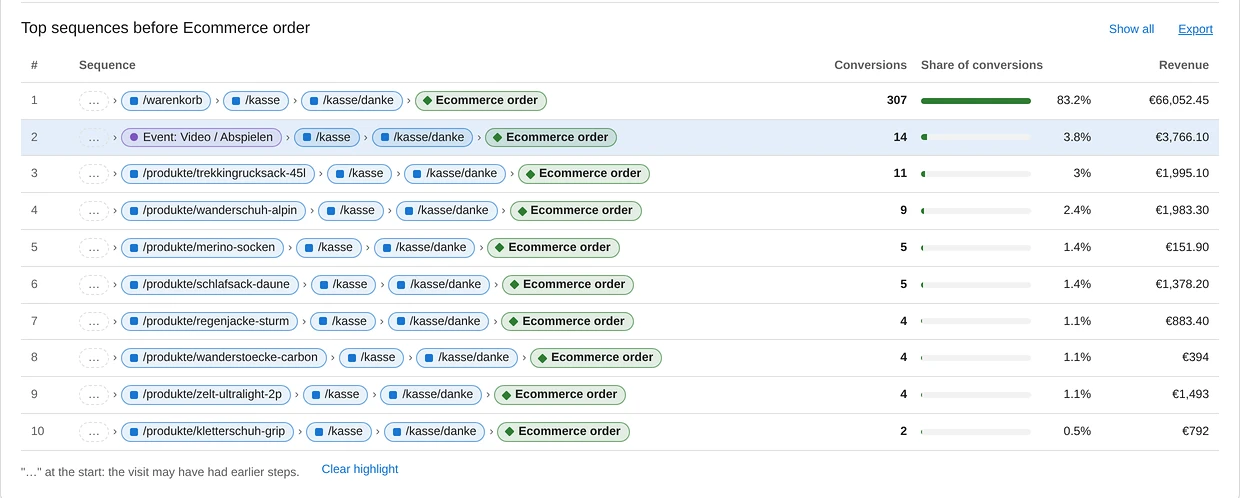
Below the chart you see the most common sequences before the goal with conversions, share and revenue. Ten rows are visible, Show all shows up to 100. A click on a row highlights exactly that path in the chart. "…" at the start of a sequence means the visit may have had earlier steps.
The example also shows a typical trap: the shop records the order on its thank-you page, so almost every sequence ends with the checkout and the thank-you page. The interesting part is the steps before. Raise Steps before the goal for that, or group the checkout pages into one entry with a rule.
On dashboards and with segments#
Both views are available as widgets. Every widget keeps its own goal, steps and entries, so the paths to an enquiry and to an order can sit side by side. Two to three steps fit into a half-width dashboard column.
Paths are available for segments that Matomo pre-processes. In the segment editor that is the option segmented reports are pre-processed (faster, requires cron). With such a segment, VisitJourney shows only the paths of one campaign, one country or, with our plugin ChannelGrouping, one of your marketing channels. More examples are in the use cases analysing visitor paths from the entry page and, for goals, conversion paths in Matomo.
How to read the results#
- One path per visit. Each path describes one visit. If someone comes back tomorrow and orders then, those are two paths. VisitJourney does not join paths across several visits.
- What is counted. Paths from the entry page count visits, on the day of their last action, like Visitors › Overview. Paths to the goal count conversions on their own day, like the goal reports. Weeks, months and years are the sum of their days.
- Identical steps in a row count once. Reloading a page doesn't make the path longer.
- "(Others)" groups rare entries. If the chart says Rare paths summarised, the archiving already grouped rare paths to keep the archives small.
- Small numbers fluctuate. Fourteen orders after a video are a hint, not proof. Choose a longer period before you rebuild pages, and remember that a frequent path shows a correlation, not a cause.
- After a rule change the next archiving run recalculates the last 30 days by default, weeks, months and years included. For older periods, run the command the plugin shows after saving, for example
./console core:invalidate-report-data --sites=1 --dates=2026-01-01,2026-09-30 --plugin=FeinwerkVisitJourney, and the archiving does the rest. Only days for which Matomo still has the raw data can be recalculated. How invalidation and archiving work together is explained in our article Matomo archiving problems: missing reports, stale data and how to fix them.
Common questions and where to look#
| Question | View | Setting |
|---|---|---|
| Where do visitors go after the home page? | Paths from the entry page, step 2 | 8 or more entries per step |
| What do campaign visitors do after the landing page? | Paths from the entry page | pre-processed campaign segment |
| How do buyers get from the product page to the basket? | Paths to the goal, ecommerce order | rule ^/products/ as "Product page" |
| Do blog articles lead to newsletter sign-ups? | Paths to the goal, newsletter goal | rule ^/blog/.+ as "Blog article" |
| What do prospects read before an enquiry? | Paths to the goal, top sequences | goal for the contact enquiry |
Checklist for your first path analysis#
- Two or three specific questions written down, with direction and period.
- URL or page title chosen, product, category and article pages grouped.
- Only the event categories enabled that matter for the journey.
- Goals checked: once or more than once per visit, the right thank-you page.
- Bot traffic excluded or deleted.
- Segments you want to analyse set to "pre-processed".
- Older periods recalculated after changes.
- Results read over a long enough period before you rebuild anything.